Module 23 R Markdown
Learning goals
- How to create
RMarkdowndocuments
- Why they are awesome
- Why they are essential to truly reproducible reporting.
R Markdown is the combination of R and Markdown: you create a Markdown document that has R built-in to it: the two languages are woven, or “knitted”, together.
Do first, explain later
Let’s not talk about it. Let’s just do it.
Start an RMarkdown report
1. Open Rstudio.
2. Click File -> New File -> R Markdown
3. Fill out “Title”, “Author”, and click “Set to HTML”
4. Type Ctrl + S to save your file in your working directory.
Compile your report
5. Have a look at the document. What does each section mean?
6. Click the “Knit” button at the top.
7. Cool, right?
But also kind of boring. Let’s make some changes to this report.
Modify the template
8. Let’s replace the “setup chunk” with the below.
9. Then, let’s change the title to some interesting question.
10. Now, let’s delete all of the other stuff in the template so far (beginning at “R Markdown”).
11. Put in some section headers using Markdown. Make the following sections:
# Introduction

# Methods

# Results

# Discussion

# Bibliography
12. Write a two-sentence introduction to your made-up research topic.
13. Knit again, to make sure that we did not break anything. (You should knit often!)
Good? Great.
Add an R chunk
In your Methods section, let’s create an R chunk in which we can generate some fake data.
To make an R chunk, type this:
```r
# code goes here
```
Those three marks represent the start and end of a chunk of code.
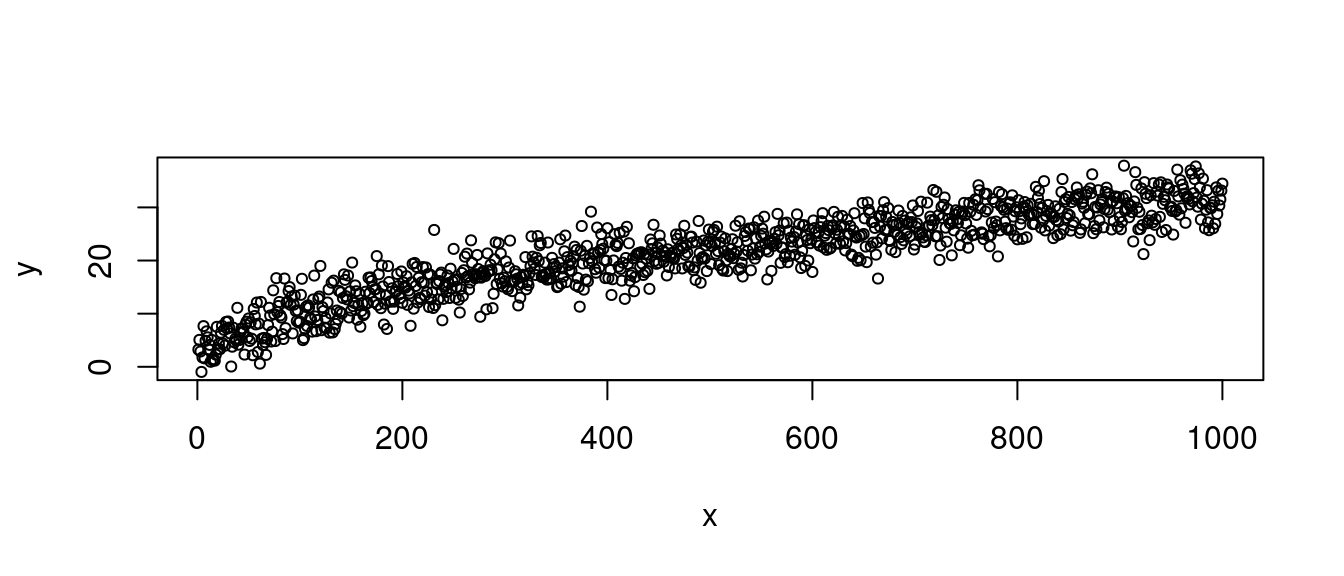
Now add this code into your chunk:
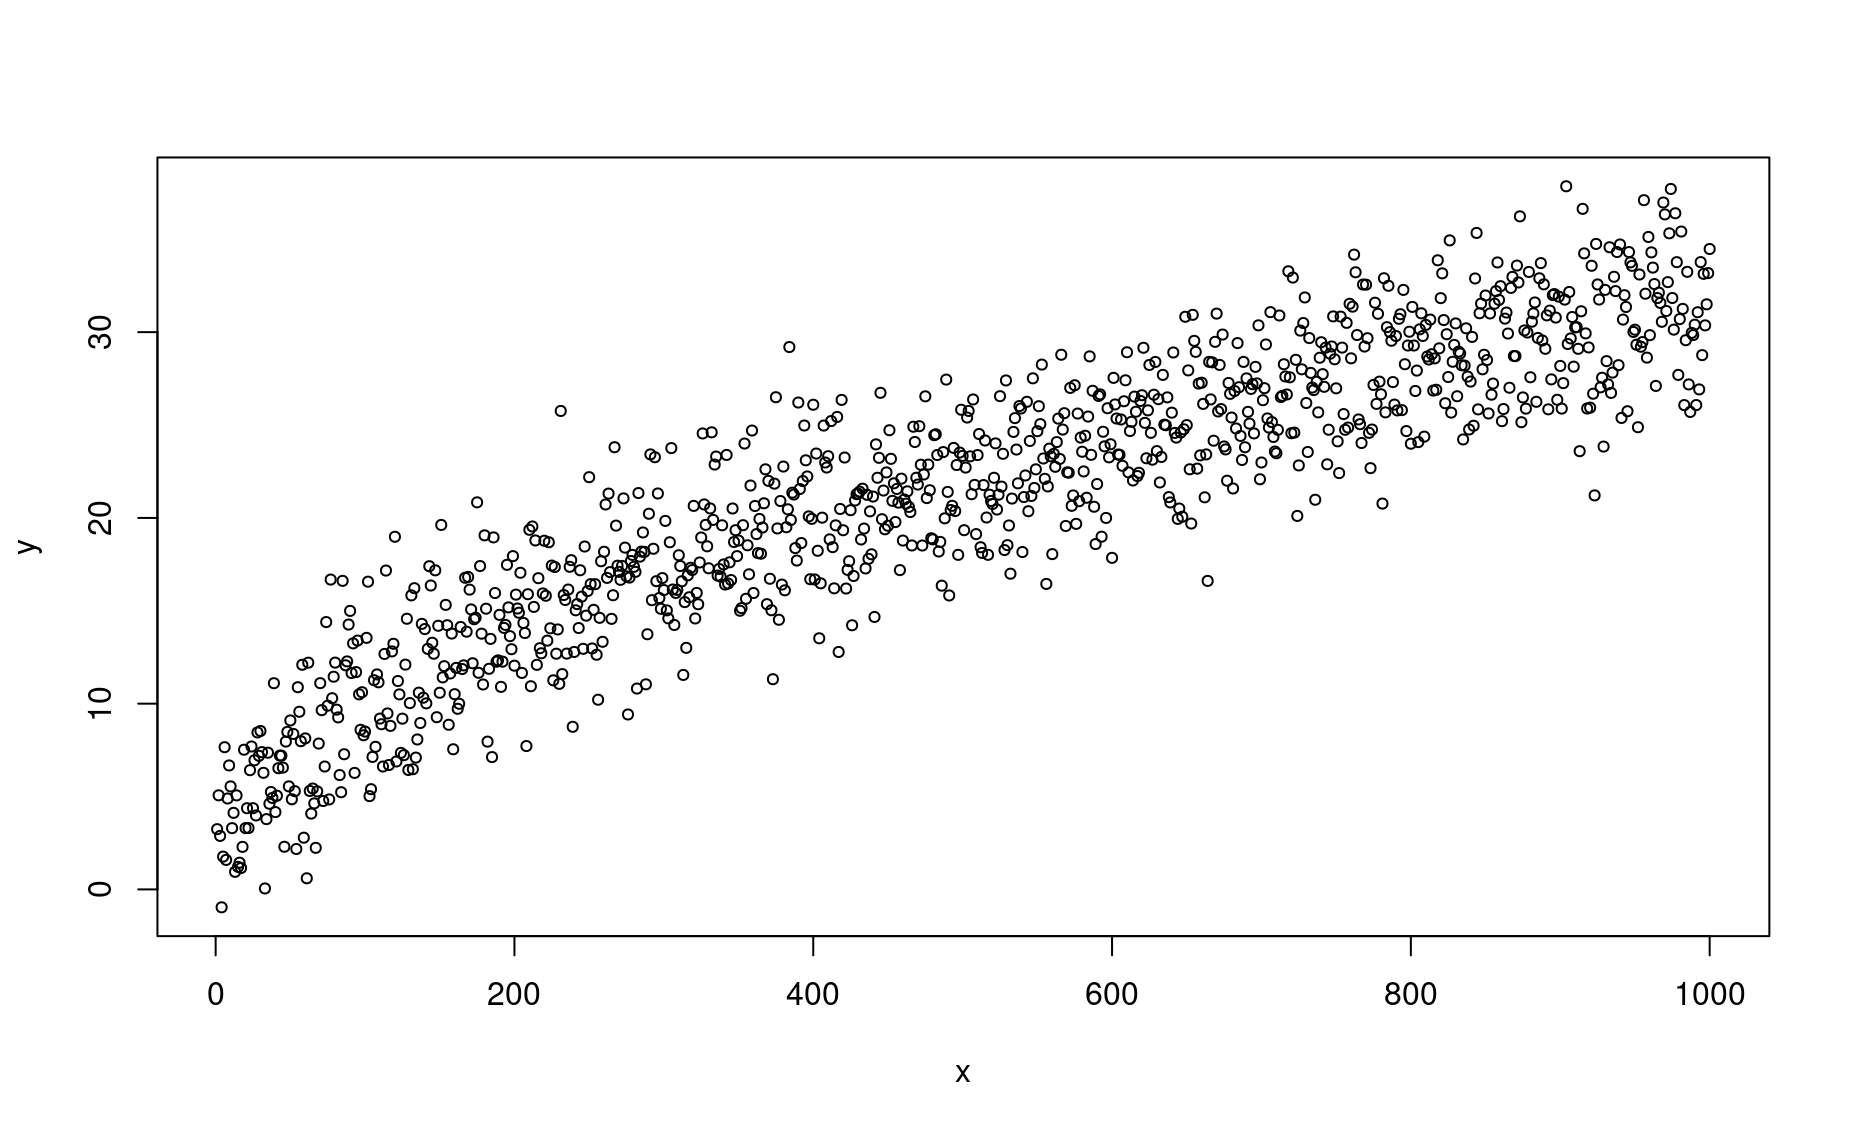
Know, re-knit your doc. Everything work?
Chunk options
Hide a chunk
To run the code within an R chunk but hide the code in your final output, change the bracketed code at the top of your chunk to read {r, echo = FALSE}.
Don’t evaluate a chunk
To skip over a chunk without evaluating it, change your brackets to look like this: {r, eval = FALSE}.
What if you want to hide a chunk and skip over it? {r, echo = FALSE, eval = FALSE}. This is a nice way to store code scraps that you don’t want to run but aren’t ready to get rid of.

In-line R code
In your Results section, add this line:
Our analysis was based on
`r length(x)`observations.
Know, re-knit your doc. What was printed before the word “observations”?
This is why RMarkdown is reproducible. Think of how a typical research report works: you get your results from
R or whatever program you are using, then you manually write those results numbers into a Word document. What is reproducible about that?
With RMarkdown, you can let the data underlying your analysis literally speak for themselves.
Tables
To make a pretty table out of a dataframe, create a chunk that looks like this:
| x | y |
|---|---|
| 1 | 3.2427774 |
| 2 | 5.0654191 |
| 3 | 2.8821258 |
| 4 | -0.9641585 |
| 5 | 1.7655092 |
| 6 | 7.6560954 |
Bibliographies
In
RStudio, create a new Text File and save it asbibliography.bibin the same location as yourRMarkdownfile.Look up this paper
Copy the
DOI.Go to https://doi2bib.org/
Copy the
bibtexformatPaste into your
.bibfile.
Note that the top line of this bib entry has the phrase Rudd2014. This is known as the citation’s “key” – you can use this phrase to reference this source within your Markdown doc.
Back in your
RMarkdowndoc, in your Discussion section, write some line about a paper.At the end of that sentence, add this text:
([@Rudd2014]).Add
bibliography: bibliography.bibto your “yaml”, the header information at the very top of yourRMarkdownfile. Change theyamlso that it looks like this:
---
output: html_document
bibliography: bibliography.bib
---- Re-
knityour doc to see what happens. Was the citation automatically generated?
Exercises
Before getting started, think of a testable hypothesis which can be answered via a survey of your friends and classmates. For example: “woman have more dreams than men”, or “people born abroad have shorter last names than people born in the USA”, or “shoe size is associated with GPA”.
1. Create a repository on github called report.
2. Clone that repository to your local machine.
3. cd into that repository.
4. In that repo, create a new Rmarkdown document. Name it paper.Rmd.
5. Replace the setup chunk with the one used in the in-class exercise (above).
6. Create a GoogleForms survey with at least 5 interesting questions on a topic which interests you (one topic, five questions).
7. Get at least 5 people to fill out your survey.
8. In your GoogleForms settings, create a GoogleSheet of your results.
9. In the sharing settings of your GoogleSheet, set to “public”.
10. Copy the URL of your GoogleSheet.
11. Create an R chunk in your paper.Rmd.
12. Use the gsheet package to read your survey results as a dataframe.
13. After reading in the data, create the following sections in your report: Introduction, Methods, Results, Conclusion.
14. Spend 5-15 minutes on the internet reading about your topic / hypotheses.
15. Find 2-5 authors/articles of interest related to your topic. Cite them in the Introduction.
16. Describe in plain English your approach to testing your hypothesis in the Methods section.
17. In your Methods section, provide a URL link to your survey.
18. After the Methods section, write the R code (in an echoed chunk) which tests your hypothesis.
19. In the Results section, write a description of both (a) your sample and (b) your results. Include at least two charts. Include at least one table.
20. In the Conclusion section, write interesting reflection on your data.
21. Got here? Cool, you’re fast. Now configure your computer to generate pdfs via Rmarkdown: mac / windows
22. Make your paper in pdf.
23. Check out these theme options for Rmarkdown docs.
24. Push your code to git
25. Check out how to make presentations in Rmarkdown. Make one.
26. Check out how to make dashboards in Rmarkdown. Make one.
27. Change your citation style. To do so, use a new csl from this site.