Module 43 Saving data & plots
Learning goals
- How to save dataframes as
.csv’s - How to save
Rdata objects as.rds’s - How to save plots as
.pdf’s and.png’s
To practice saving data (a.k.a. exporting data), let’s use the built-in dataset from package babynames.
write.csv()
To write a dataframe to a .csv, use the function write.csv().
This dataset will be saved as the file, my_babynames.csv within your parent directory. You can set other destinations using the same rules for child paths, parent paths, and absolute paths from the module on Importing Data.
The code above sets a couple parameters that preserves the neat formatting of your dataframe. We recommend using these inputs each time you use write.csv() to save a dataframe.
saveRDS()
The saveRDS() function saves R objects in the .rds format, which makes them easier and faster to read into R later on.
pdf() and png()
Let’s say you want to plot the prevalence of the name “Barack” in recent U.S history:
head(babynames)
# A tibble: 6 × 5
   year sex   name          n   prop
  <dbl> <chr> <chr>     <int>  <dbl>
1  1880 F     Mary       7065 0.0724
2  1880 F     Anna       2604 0.0267
3  1880 F     Emma       2003 0.0205
4  1880 F     Elizabeth  1939 0.0199
5  1880 F     Minnie     1746 0.0179
6  1880 F     Margaret   1578 0.0162
baracks <- babynames[babynames$name=="Barack",]
plot(prop~year,data=baracks,
     type="b",pch=16,
     xlim=c(2000,2018),
     xlab="Year",ylab="Proportion of names",main="Barack")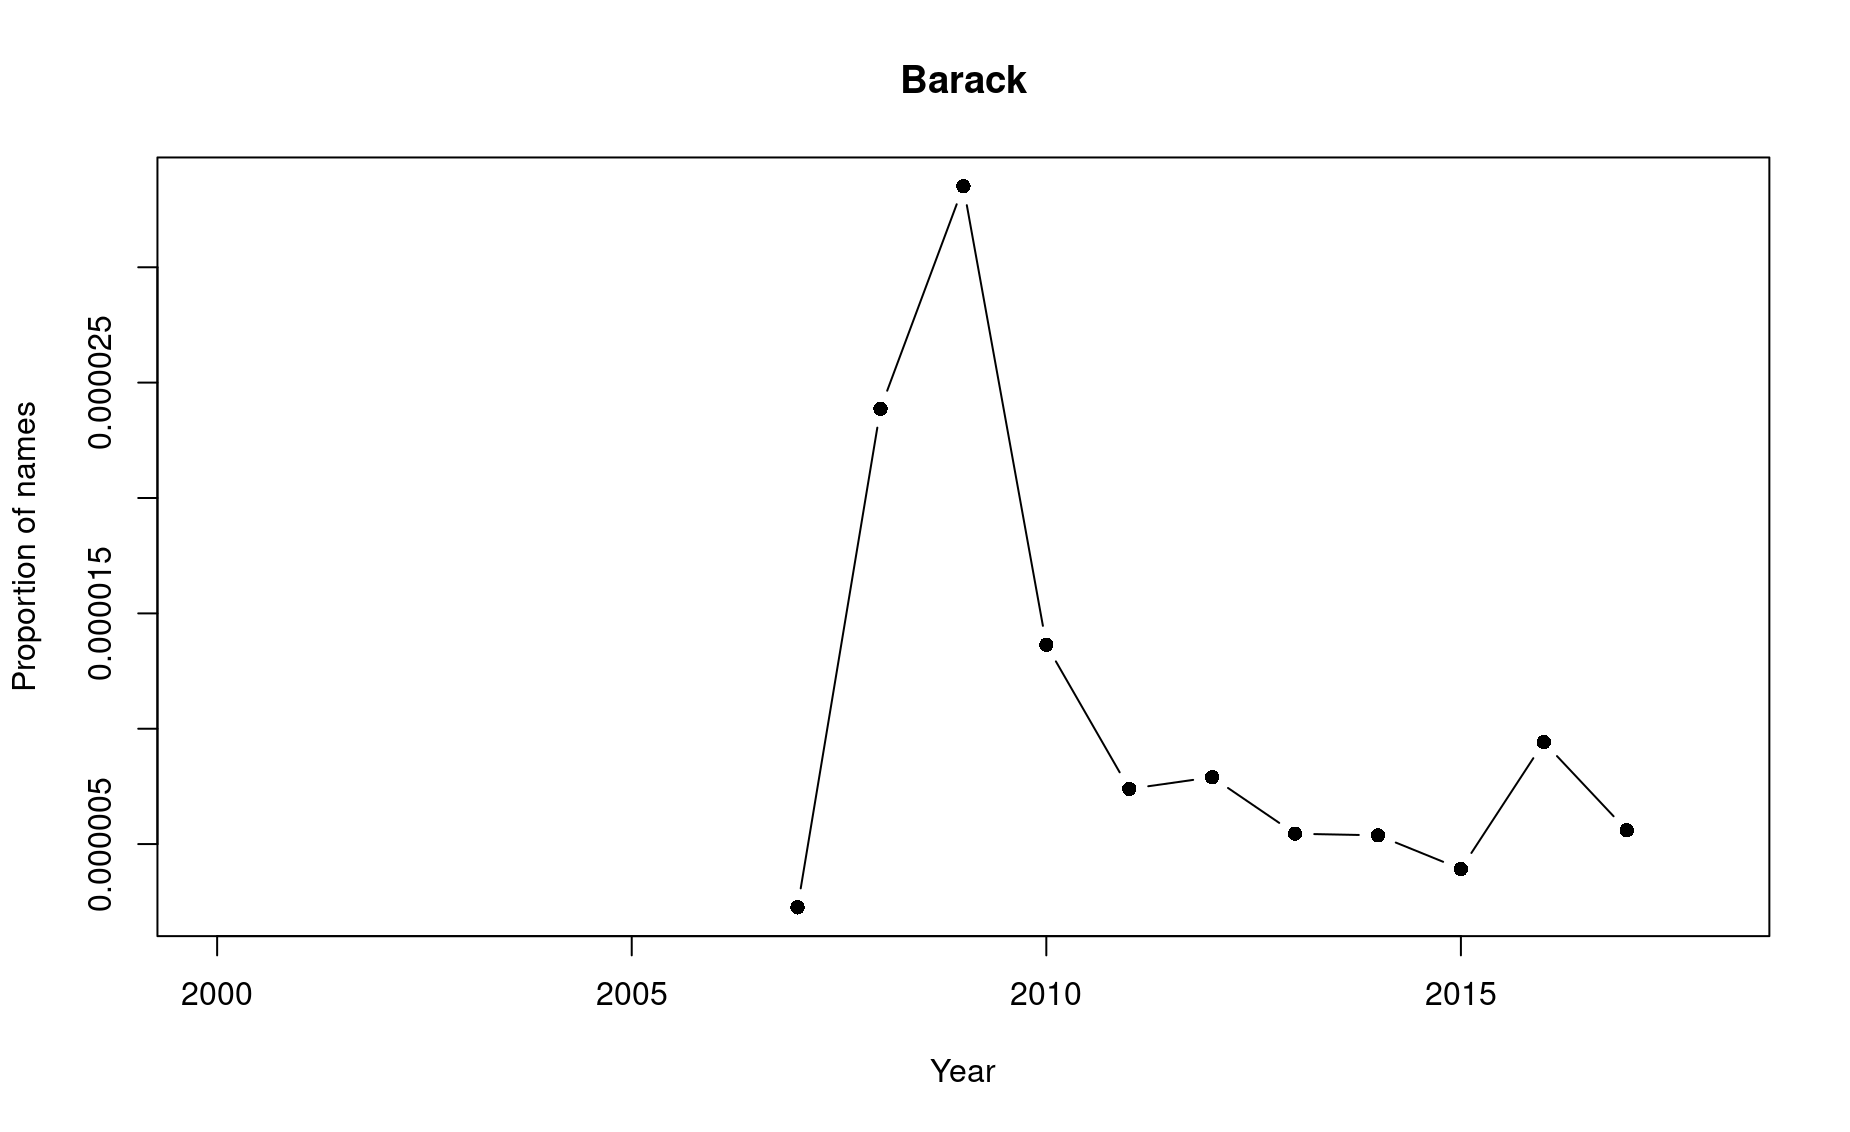
To save this as a figure as a pdf, preface these lines of code with a pdf() command and add dev.off() below those lines. This opens up a pdf ‘device’ (i.e., an engine for creating a PDF file), prints the plot to that new file, then closes the device and saves the file.
Saving a pdf:
pdf("barack-years.pdf",width-6,height=4)
plot(prop~year,data=baracks,
     type="b",pch=16,
     xlim=c(2000,2018),
     xlab="Year",ylab="Proportion of names",main="Barack")
dev.off()
Make sure you add ‘.pdf’ to the end of your filename, and try not to run the dev.off() command when you have not first run the pdf command. If you do, R will think you are turning off the plotting feature in RStudio and you will have to restart your R session in order to see any more plots.